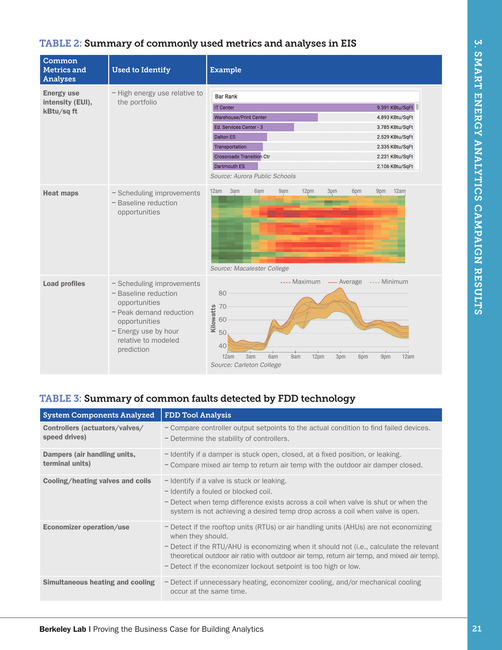
CommonMetrics andAnalysesEnergy useintensity (EUI),kBtu/sq ftUsed to IdentifyExampleHigh energy use relative tothe portfolioSource: Aurora Public SchoolsHeat mapsScheduling improvementsBaseline reductionopportunities12am3am6am9am12pm3pm6pm9pm12amSource: Macalester CollegeScheduling improvementsBaseline reductionopportunitiesPeak demand reductionopportunitiesEnergy use by hourrelative to modeledpredictionMaximumAverageMinimum80KilowattsLoad profiles703. SMART ENERGY ANALYTICS CAMPAIGN RESULTSTABLE 2: Summary of commonly used metrics and analyses in EIS60504012am3am6am9am12pm3pm6pm9pm12amSource: Carleton CollegeTABLE 3: Summary of common faults detected by FDD technologySystem Components AnalyzedControllers (actuators/valves/speed drives)Dampers (air handling units,terminal units)Cooling/heating valves and coilsFDD Tool AnalysisEconomizer operation/useSimultaneous heating and coolingCompare controller output setpoints to the actual condition to find failed devices.Determine the stability of controllers.Identify if a damper is stuck open, closed, at a fixed position, or leaking.Compare mixed air temp to return air temp with the outdoor air damper closed.Identify if a valve is stuck or leaking.Identify a fouled or blocked coil.Detect when temp difference exists across a coil when valve is shut or when thesystem is not achieving a desired temp drop across a coil when valve is open.Detect if the rooftop units (RTUs) or air handling units (AHUs) are not economizingwhen they should.Detect if the RTU/AHU is economizing when it should not (i.e., calculate the relevanttheoretical outdoor air ratio with outdoor air temp, return air temp, and mixed air temp).Detect if the economizer lockout setpoint is too high or low.Detect if unnecessary heating, economizer cooling, and/or mechanical coolingoccur at the same time.Berkeley Lab | Proving the Business Case for Building Analytics21
It seems that your browser's pop-up blocker has prevented us from opening a new window/tab. Please click the button below to open the link manually.